

If you’ve worked with any kind of data, you know how harrowing
reading rows and rows of numbers can be. It isn’t easy to wade through
all of those numbers and easily figure out what they mean. That’s the
case where visualization comes to the rescue. Visualization de-mystifies
the data and helps decision makers derive actionable insights from it.
“Dataviz” is the abbreviation of “Data visualization” whose primary goal is
There are many jQuery plugins charts available that can help you to
create interactive dataviz for your web page. But which ones really
deliver value? In this article I’ve rounded up my favorites and
highlighted which scenario each is best suited for. In this way you
won’t waste time and effort searching for them and will have an accurate
outline of your current possibilities of choice.
A short note before we get to the list: I have only covered 11 best libraries in this article, but if you do a quick search you will find more than 70 different options. No matter how good this list is, you will still come across cases where you will need something else. So what do you do then? How do you evaluate a JS charting library?
Well, there is no easy easy answer to that. But here’s something that might help: a detailed post on all the factors to consider while evaluating a JavaScript charting library. It explains all possible factors that go into making the selection in good detail.
Now, let’s get started!
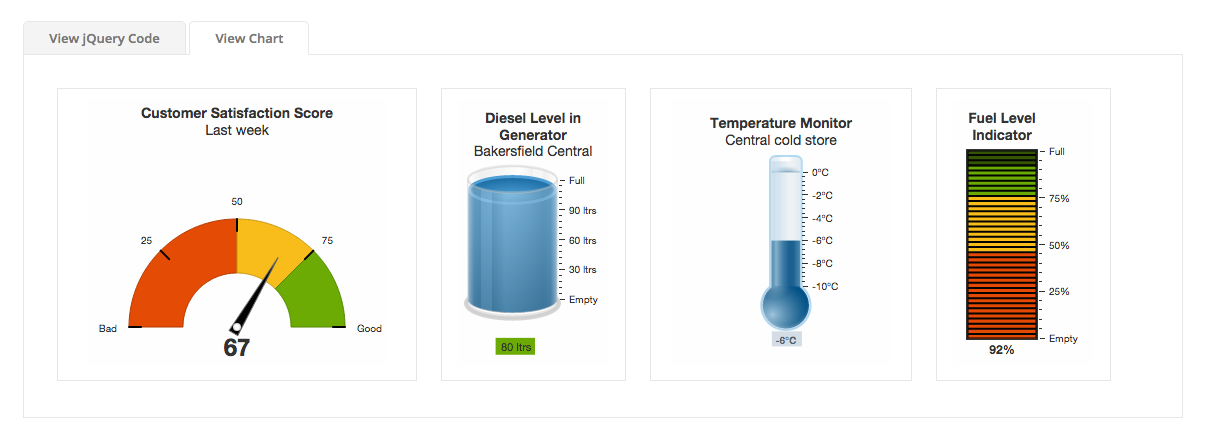
Apart from the JavaScript Charts, FusionCharts also offers a jQuery plugin which packs all the goodness of FusionCharts – smart design, animation and a rich interactive experience. The charts work seamlessly across all device types including PCs, Macs, Android devices as well as iPads and iPhones. It’s also backward compatible with browsers up to IE6.
This jQuery charts plugin has some really powerful features. Charts can be rendered from JSON data, XML data, or HTML tables. Many common events that occur through the lifetime of a chart are exposed (there’s a full list here), thus making it easy for you to attach listeners to perform specific actions.
They have a handy usage guide to help you get started with the plugin and live code snippets you can use directly. The plugin and code samples are also available on Github.
License: Free for non-commercial, paid for commercial uses.
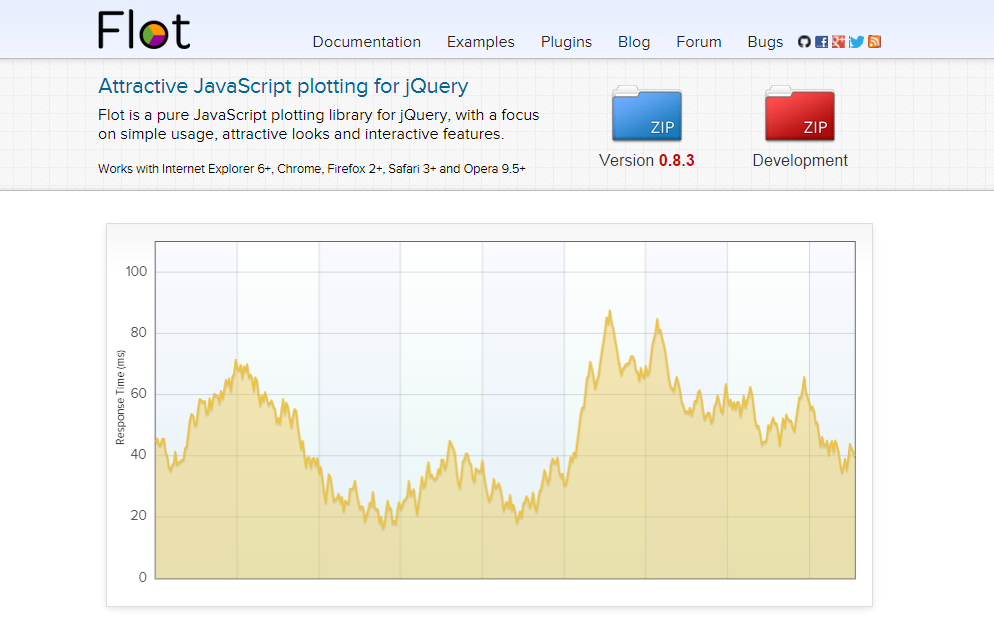
In Danish, flot (rhyming with ‘plot’) means elegant, attractive, impressive and that’s exactly what the Flot library aims to do. Its primary focus is creating easy-to-use, attractive, and interactive charts and graphs. Interactive features include turning a series on or off, panning and zooming, interacting with data points and automatic re-sizing. Other features include support for multiple axes, stacked chart and rendering text with Canvas instead of HTML. Many other functions are available as plugins.
To help you along, there is a series of videos showing how to use Flot, and many illustrative examples that you can refer to as well.
License: Open-source. Free for all uses.
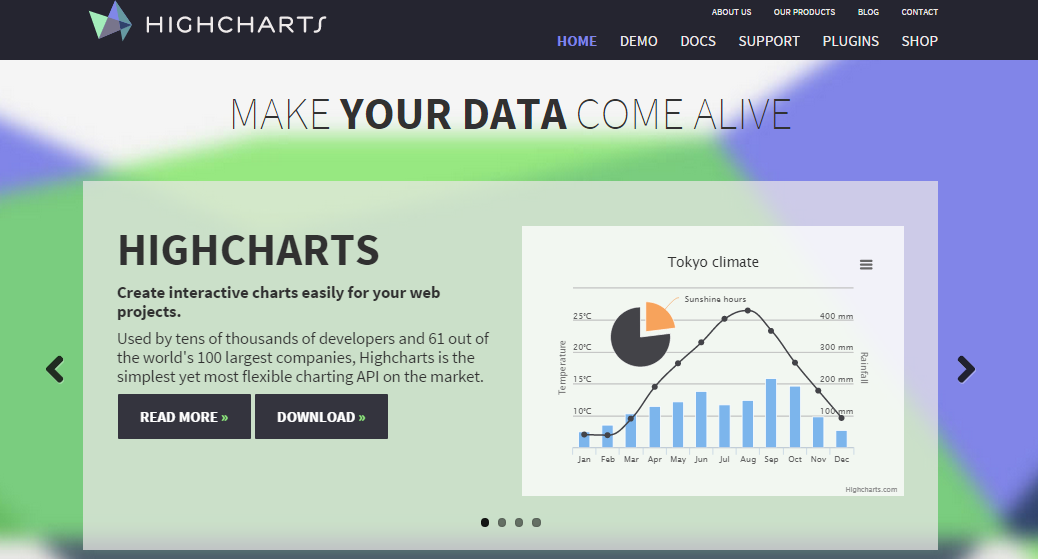
Highcharts is another popular JavaScript charting library. It was released in 2009 and its adoption has constantly grown since then. It offers common charts, maps, and stock charts.
You can download the jQuery adapter from the main download page along with the Highcharts library itself. It allows you to explore all the powerful features without the need to deal with vanilla JavaScript.
Like FusionCharts, it also supports all browsers (including IE6), devices, and platforms. There’s pretty good community support for Highcharts and you can find all the plugins developed by the community on this page. Another cool feature of Highcharts is the demo section, which allows you to get up and running very fast.
License: Free for non-commercial, paid for commercial uses.
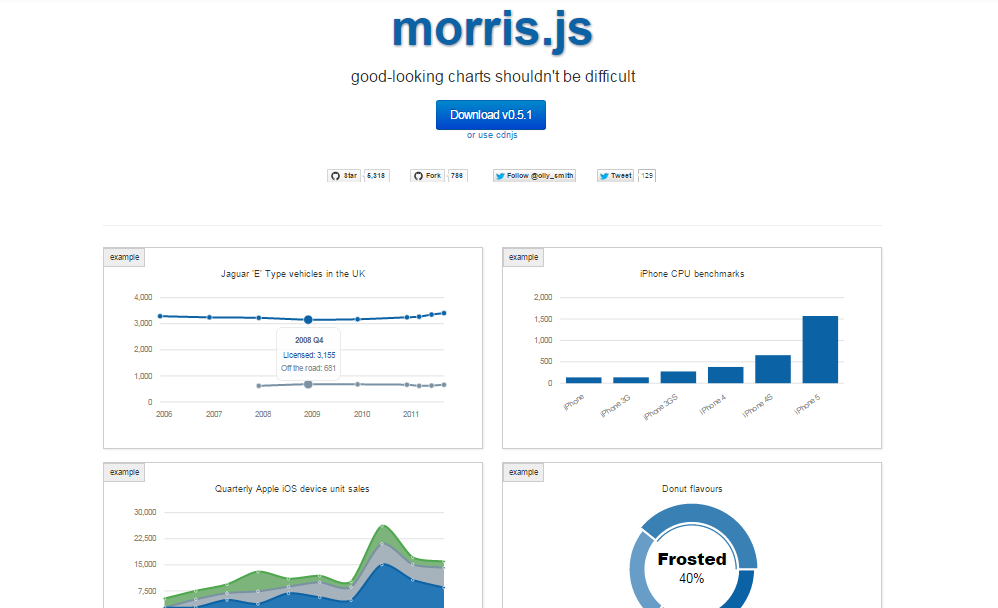
Morris.js is a powerful library with a clean interface. It’s based on jQuery and the Raphaël JavaScript library. The main goal is to provide beautiful charts, that are easy to use. Default chart types include line, bar, area, and donut graphs. The library has some examples that you can take a look at with code that shows how to get started and create good looking charts in few minutes.
License: Simplified BSD License.
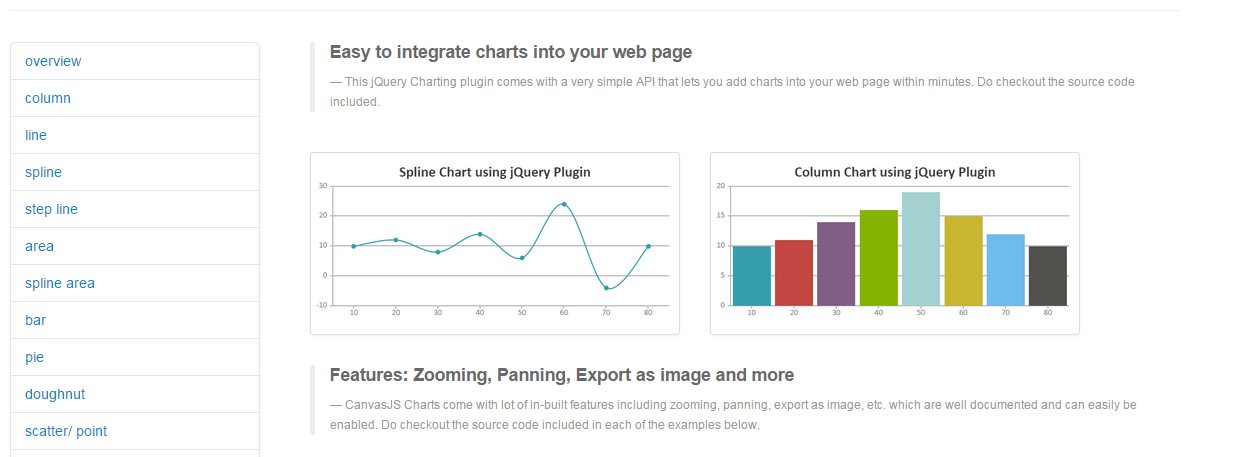
CanvasJS jQuery is the jQuery charting plugin that comes with CanvasJS. When using this jQuery plugin, you can utilise all the standard functions of CanvasJS, along with an extended feature set that includes dynamic updates, panning and zooming, events and exporting as images. The charts perform fairly well for large data-sets and the basic package includes 24 different chart types, all of which are responsive.
Here are some good examples with source code that showcase the charting features as well as the jQuery UI integration.
License: Free for non-commercial, paid for commercial uses.
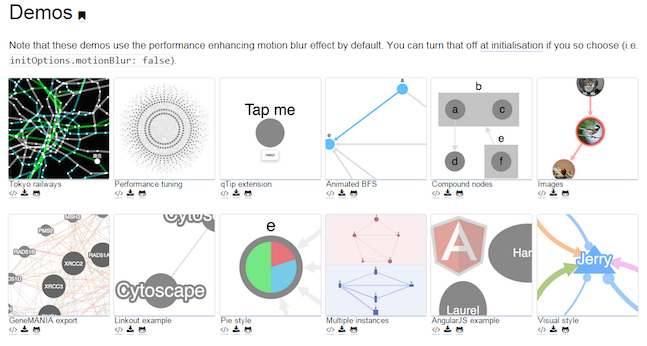
Cytoscape.js isn’t your regular charting library, but it’s impressive enough to be included in this list. Unlike the other plugins we’ve discussed so far, Cytoscape is really a jQuery graphing library (i.e. it helps visualizing graphs or networks). It’s highly optimized when it comes to converting raw network data into graphs and can handle large amounts of data well. It’s compatible with all modern browsers, CommonJS/NodeJS, jQuery and Meteor/Atmosphere. It also supports touch events and standard gestures. For a more comprehensive list of features, please refer to the Cytoscape.js factsheet page.
The documentation of Cytoscape.js includes live code examples, even for interactive cases, and a full suite of unit tests.
License: Open-source. Free for all users. (LGPL3+)
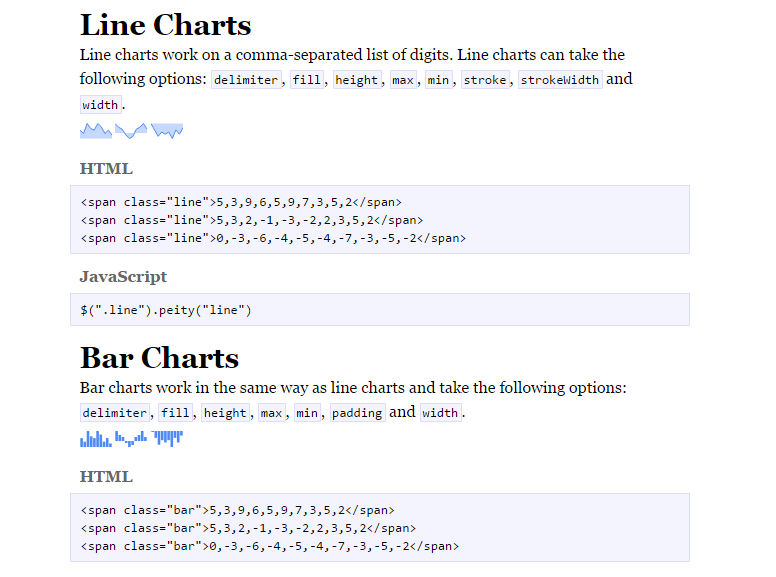
Sometimes you just need small graphs inline with your content, and Peity is a perfect solution for those situations. It enables you to easily convert small data sets into inline bar charts, donut graphs, line graphs, or mini pies, with a single line of code. These are in the form of
License: Open-source under the MIT License.
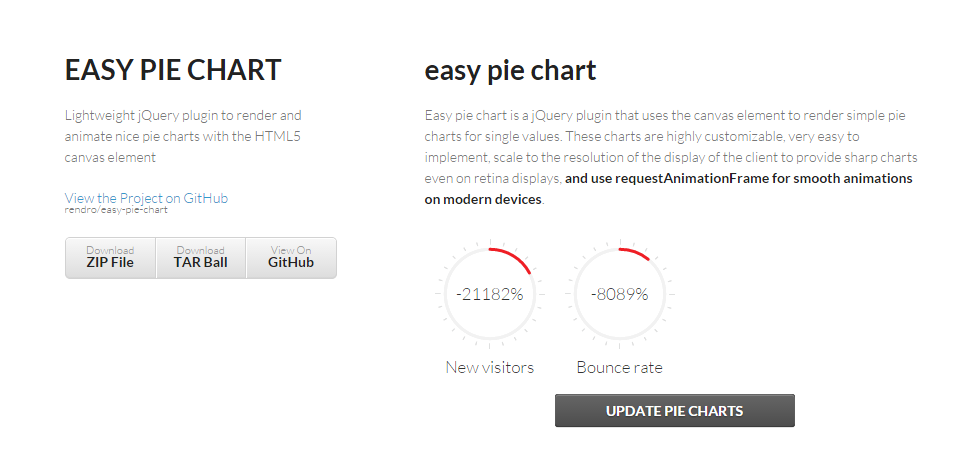
While we’re talking of simple and efficient, I have to mention Easy Pie Chart. This is a jQuery plugin that does one thing, and one thing only – it renders simple pie charts for single values. It uses the
The plugin is compatible with all modern browsers that support the
License: Open-source under the MIT License.
jqPlot is a jQuery plugin that lets you insert pure client-side charts into your web pages. jqPlot boasts of strong ‘pluggability’ in that all computations and drawings – lines, axes, shadows, grid, and so on – are done via pluggable renderers and plot elements are highly customizable. There are many hooks into the core that enable you to extend functionality to handle custom events, add new plot types, add new canvases to the plot and other advanced features.
Detailed usage tutorials of jqPlot are available here. Examples of dynamically rendered plots and some unit tests are also available.
License: Open source project. Dual licensed under the MIT and GPL version 2 licenses.
jQuery Sparklines (similar to Peity) lets you generate small inline charts with data that are supplied either directly in the HTML or through embedded JavaScript. Each example shown in the image above takes just one line of code to create. The best part is, you don’t even have to write that code yourself. There is a neat code generator (under the head “Try it Out”) where you can fill in the data and set the options, and have the code generated for you. Note that you can’t add any text or labels to these sparklines. They are meant to provide quick impressions or trends inline with your text. If you want annotations or other features, you’re better off going with one of the full fledged plugins we covered above.
In case you want to use this plugin, there is a detailed documentation covering the options, syntax and advanced usage.
License: Open-source. Free for all uses.
So far we’ve talked about plugins that do your regular graphs and charts, plugins that help you with network graphs, and also some for inline mini-graphs and charts. But if you need a dashboard with project management features, you’ll want to use Gantt charts. The jQuery.Gantt plugin lets you visualize Gantt charts using Ajax to retrieve JSON data. Features include panning, zooming, paging, multiple tasks per row, different colors for each task, marking holidays and others. To learn more about this plugin, you can read its detailed documentation that covers how to use it and the parameters available.
If Gantt charts are your passion, I suggest you to read the article Making your own Gantt chart with Webix by Sergey Laptick that discusses how to create a Gantt chart application using the Webix framework in combination with an open source JavaScript Gantt chart called dhtmlxGantt. It’s well worth a reading.
License: Open source project. Dual under the MIT and GPL license.
How about you? What do you use when you need to create charts and graphs? What’s your favorite plugin/library and why? Share with us in the comments below and let’s start a discussion.
“Dataviz” is the abbreviation of “Data visualization” whose primary goal is
to communicate information clearly and efficiently to users via the statistical graphics, plots, information graphics, tables, and charts selected.As developers, we’ve to ensure that we use the right tools to create meaningful charts from the data, in a way that provides the appropriate amount of details while keeping an eye on the big picture.
More from this author
A short note before we get to the list: I have only covered 11 best libraries in this article, but if you do a quick search you will find more than 70 different options. No matter how good this list is, you will still come across cases where you will need something else. So what do you do then? How do you evaluate a JS charting library?
Well, there is no easy easy answer to that. But here’s something that might help: a detailed post on all the factors to consider while evaluating a JavaScript charting library. It explains all possible factors that go into making the selection in good detail.
Now, let’s get started!
1. FusionCharts
Apart from the JavaScript Charts, FusionCharts also offers a jQuery plugin which packs all the goodness of FusionCharts – smart design, animation and a rich interactive experience. The charts work seamlessly across all device types including PCs, Macs, Android devices as well as iPads and iPhones. It’s also backward compatible with browsers up to IE6.
This jQuery charts plugin has some really powerful features. Charts can be rendered from JSON data, XML data, or HTML tables. Many common events that occur through the lifetime of a chart are exposed (there’s a full list here), thus making it easy for you to attach listeners to perform specific actions.
They have a handy usage guide to help you get started with the plugin and live code snippets you can use directly. The plugin and code samples are also available on Github.
License: Free for non-commercial, paid for commercial uses.
2. Flot
In Danish, flot (rhyming with ‘plot’) means elegant, attractive, impressive and that’s exactly what the Flot library aims to do. Its primary focus is creating easy-to-use, attractive, and interactive charts and graphs. Interactive features include turning a series on or off, panning and zooming, interacting with data points and automatic re-sizing. Other features include support for multiple axes, stacked chart and rendering text with Canvas instead of HTML. Many other functions are available as plugins.
To help you along, there is a series of videos showing how to use Flot, and many illustrative examples that you can refer to as well.
License: Open-source. Free for all uses.
3. Highcharts
Highcharts is another popular JavaScript charting library. It was released in 2009 and its adoption has constantly grown since then. It offers common charts, maps, and stock charts.
You can download the jQuery adapter from the main download page along with the Highcharts library itself. It allows you to explore all the powerful features without the need to deal with vanilla JavaScript.
Like FusionCharts, it also supports all browsers (including IE6), devices, and platforms. There’s pretty good community support for Highcharts and you can find all the plugins developed by the community on this page. Another cool feature of Highcharts is the demo section, which allows you to get up and running very fast.
License: Free for non-commercial, paid for commercial uses.
4. Morris.js
Morris.js is a powerful library with a clean interface. It’s based on jQuery and the Raphaël JavaScript library. The main goal is to provide beautiful charts, that are easy to use. Default chart types include line, bar, area, and donut graphs. The library has some examples that you can take a look at with code that shows how to get started and create good looking charts in few minutes.
License: Simplified BSD License.
5. CanvasJS jQuery
CanvasJS jQuery is the jQuery charting plugin that comes with CanvasJS. When using this jQuery plugin, you can utilise all the standard functions of CanvasJS, along with an extended feature set that includes dynamic updates, panning and zooming, events and exporting as images. The charts perform fairly well for large data-sets and the basic package includes 24 different chart types, all of which are responsive.
Here are some good examples with source code that showcase the charting features as well as the jQuery UI integration.
License: Free for non-commercial, paid for commercial uses.
6. Cytoscape.js
Cytoscape.js isn’t your regular charting library, but it’s impressive enough to be included in this list. Unlike the other plugins we’ve discussed so far, Cytoscape is really a jQuery graphing library (i.e. it helps visualizing graphs or networks). It’s highly optimized when it comes to converting raw network data into graphs and can handle large amounts of data well. It’s compatible with all modern browsers, CommonJS/NodeJS, jQuery and Meteor/Atmosphere. It also supports touch events and standard gestures. For a more comprehensive list of features, please refer to the Cytoscape.js factsheet page.
The documentation of Cytoscape.js includes live code examples, even for interactive cases, and a full suite of unit tests.
License: Open-source. Free for all users. (LGPL3+)
7. Peity
Sometimes you just need small graphs inline with your content, and Peity is a perfect solution for those situations. It enables you to easily convert small data sets into inline bar charts, donut graphs, line graphs, or mini pies, with a single line of code. These are in the form of
svg and hence compatible with any browser that supports the svg
element, including Chrome, Opera, Firefox, IE9+, and Safari. You can
also customize the visual elements of the chart and set dynamic colors.
Charts can be updated to reflect changes in the data. Events are also
supported. Many examples with live code are included on the Github page.License: Open-source under the MIT License.
8. Easy Pie Chart
While we’re talking of simple and efficient, I have to mention Easy Pie Chart. This is a jQuery plugin that does one thing, and one thing only – it renders simple pie charts for single values. It uses the
canvas
element to render these charts. The charts are easy to customize and
take just a few lines of code. They are also responsive and scale
accordingly to the display resolution to provide crisp charts, even on
retina displays.The plugin is compatible with all modern browsers that support the
canvas element. On IE 8 and older versions, you can render the charts using excanvas. You can check out some interesting demos on Github.License: Open-source under the MIT License.
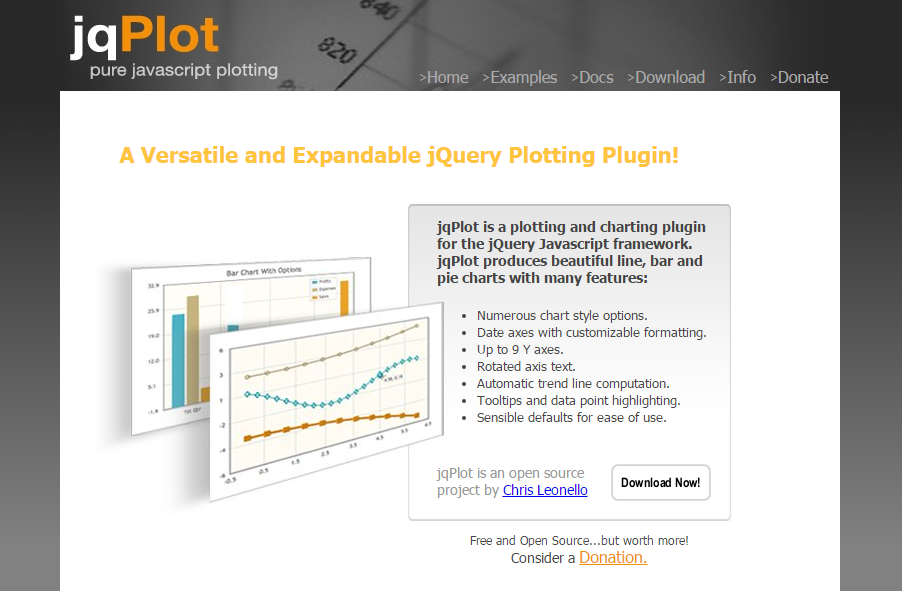
9. jqPlot
jqPlot is a jQuery plugin that lets you insert pure client-side charts into your web pages. jqPlot boasts of strong ‘pluggability’ in that all computations and drawings – lines, axes, shadows, grid, and so on – are done via pluggable renderers and plot elements are highly customizable. There are many hooks into the core that enable you to extend functionality to handle custom events, add new plot types, add new canvases to the plot and other advanced features.
Detailed usage tutorials of jqPlot are available here. Examples of dynamically rendered plots and some unit tests are also available.
License: Open source project. Dual licensed under the MIT and GPL version 2 licenses.
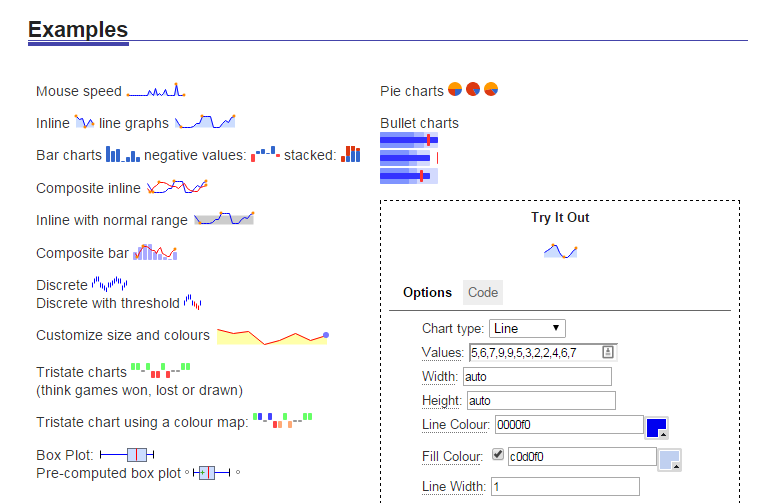
10. jQuery Sparklines
jQuery Sparklines (similar to Peity) lets you generate small inline charts with data that are supplied either directly in the HTML or through embedded JavaScript. Each example shown in the image above takes just one line of code to create. The best part is, you don’t even have to write that code yourself. There is a neat code generator (under the head “Try it Out”) where you can fill in the data and set the options, and have the code generated for you. Note that you can’t add any text or labels to these sparklines. They are meant to provide quick impressions or trends inline with your text. If you want annotations or other features, you’re better off going with one of the full fledged plugins we covered above.
In case you want to use this plugin, there is a detailed documentation covering the options, syntax and advanced usage.
License: Open-source. Free for all uses.
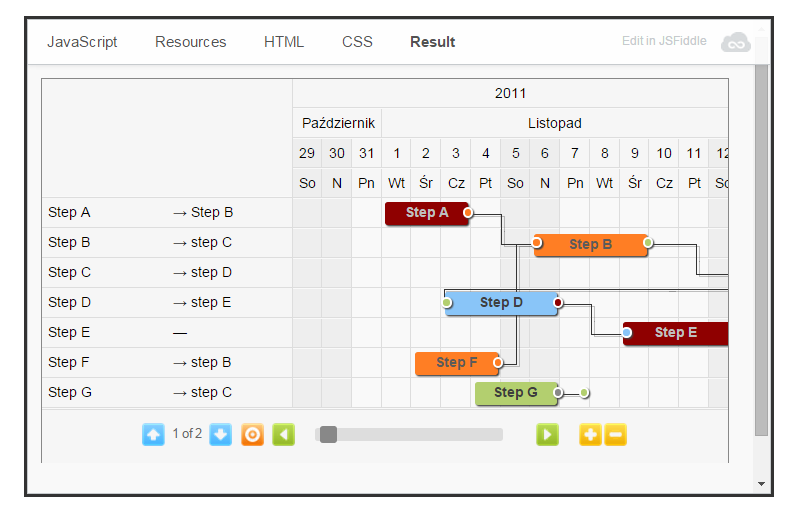
11. jQuery.Gantt
So far we’ve talked about plugins that do your regular graphs and charts, plugins that help you with network graphs, and also some for inline mini-graphs and charts. But if you need a dashboard with project management features, you’ll want to use Gantt charts. The jQuery.Gantt plugin lets you visualize Gantt charts using Ajax to retrieve JSON data. Features include panning, zooming, paging, multiple tasks per row, different colors for each task, marking holidays and others. To learn more about this plugin, you can read its detailed documentation that covers how to use it and the parameters available.
If Gantt charts are your passion, I suggest you to read the article Making your own Gantt chart with Webix by Sergey Laptick that discusses how to create a Gantt chart application using the Webix framework in combination with an open source JavaScript Gantt chart called dhtmlxGantt. It’s well worth a reading.
License: Open source project. Dual under the MIT and GPL license.
Conclusions
The roundup of my favorite jQuery charting libraries – at least the ones that I’ve used and tried – ends here. Between them, they cover just about every chart type, functionality, and customization you could need.How about you? What do you use when you need to create charts and graphs? What’s your favorite plugin/library and why? Share with us in the comments below and let’s start a discussion.
Tags: ajax, amazing jquery plugins, data visualization, JavaScript, jQuery, jquery chart plugins, jquery charting libraries, json
from https://www.sitepoint.com/11-best-jquery-charting-libraries/


0 Komentar